
Have you ever heard of technical analysis in crypto trading? What do you think is their role?
Imagine this: a world where your crypto moves aren’t just based on luck or gut feelings but on real insights.
That’s where the magic of Technical Analysis steps in – it’s like reading the signs hidden within price charts to make better predictions.
In this electrifying blog post, I’ll demystify the enigmatic art of technical analysis in crypto trading.
I’ll reveal the importance of technical analysis in crypto trading and why it’s the secret sauce that countless successful traders sprinkle on their strategies.
No need to worry about confusing terms – I’m breaking everything down for you.
It doesn’t matter if you’re new or experienced looking to fine-tune your skills, understanding the power of crypto technical analysis is like unlocking a treasure trove of insights.
So, buckle up because, by the end of this read, you’ll not only grasp the fundamentals of technical analysis in crypto but also be armed with the knowledge to elevate your crypto trading game.
Get ready to unlock insights that could potentially lead you to that next game-changing trade and who knows, maybe even the coveted title of a crypto maestro.
What is Technical Analysis in Cryptocurrency?
Have you ever looked at a crypto price chart and wondered if there was a method behind the madness of those fluctuating lines and candles?
That’s where crypto technical analysis swoops in to save the day.
At its core, technical analysis is the art and science of examining historical price and trading volume data to forecast future price movements of an asset, such as cryptocurrencies.
Picture this: you’re a detective investigating a crime scene.
Instead of fingerprints and footprints, you’re scrutinizing price movements, volume trends, and chart patterns.
Just like a detective connects the dots to solve a mystery, technical analysis connects the dots of price data to predict potential future price movements.
It operates on the principle that market trends, patterns, and behaviors repeat over time, allowing traders to make informed decisions based on past price movements.
Tools of Technical Analysis in Crytpo Trading
In cryptocurrency trading, where digital assets fluctuate at lightning speed, technical analysis serves as the trader’s compass, guiding them through the tumultuous waters of price volatility.
This compass is comprised of a diverse array of tools and indicators, each designed to decode the patterns and trends woven into the fabric of price charts.
Let’s delve into the essential tools that form the backbone of technical analysis in crypto trading:
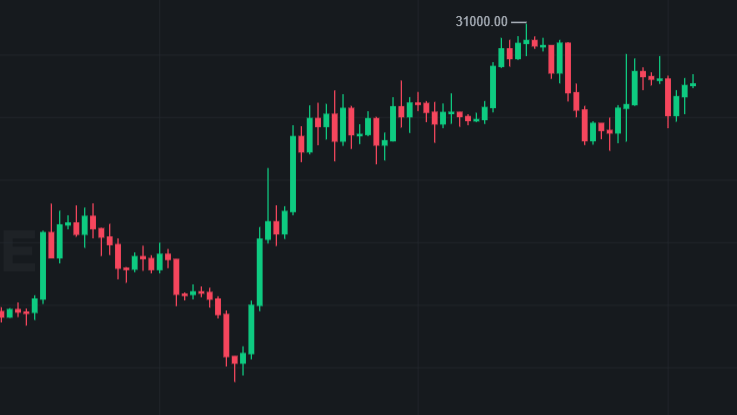
1. Moving Averages
Like a steady hand guiding a ship, moving averages smooth out price data over a specified period, providing a clearer view of the underlying trend.
Simple Moving Averages (SMA) consider an average over a set number of periods, while Exponential Moving Averages (EMA) give more weight to recent prices.
Crossovers of different moving averages can signal potential trend reversals or confirm existing trends.
For example, when the price crosses above a moving average, it might indicate an uptrend.
Conversely, a crossover below could signal a downtrend.
Moving averages also help you identify potential reversals when they converge or diverge from each other.
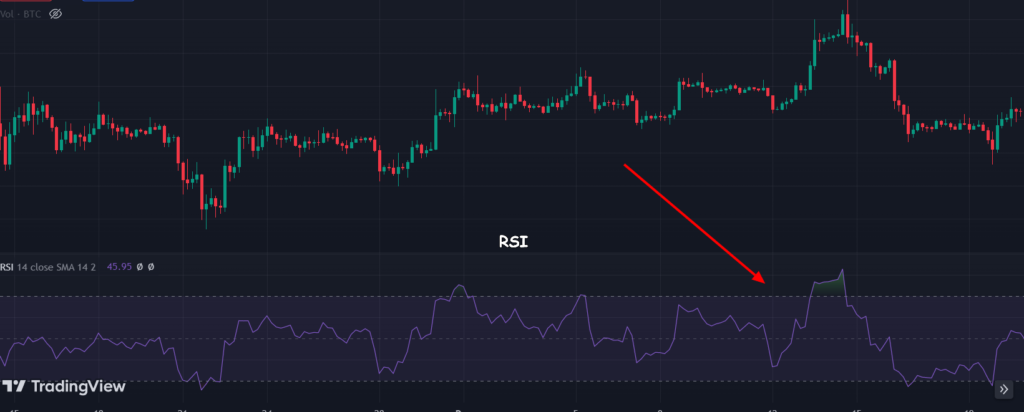
2. Relative Strength Index (RSI)
Acting as a warning bell, the RSI measures the speed and change of price movements to assess whether an asset is overbought or oversold.
When RSI is above 70, it suggests the cryptocurrency might be overbought and due for a potential pullback.
Conversely, an RSI below 30 could indicate oversold conditions and a possible bounce back.
3. Bollinger Bands
Much like the ebb and flow of tides, Bollinger Bands consist of three lines: a central moving average flanked by two standard deviation bands.
These bands expand and contract with price volatility.
When prices touch or cross these bands, it can signal potential overbought or oversold conditions or even impending price breakouts.
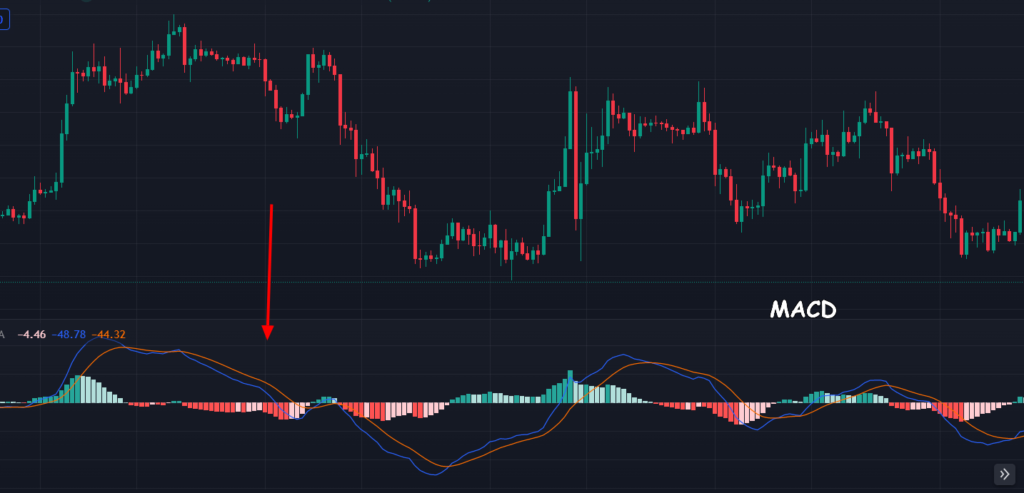
4. Moving Average Convergence Divergence (MACD)
Think of the MACD as a duo of detectives working together – one solving mysteries, the other verifying their findings.
The MACD line represents the difference between two moving averages (usually 12-day and 26-day EMAs).
The signal line is a smoothed version of the MACD line, while the histogram shows the gap between them.
A positive histogram indicates bullish momentum, while a negative one suggests bearish momentum.
When the MACD line crosses above the signal line, it signals a potential uptrend.
Conversely, a crossover below indicates a potential downtrend.
MACD crossovers are like puzzle pieces – when they fit, they reveal a clearer picture of market sentiment.
5. Support and Resistance Levels
These act as sturdy pillars amidst price fluctuations.
Support represents a price level where an asset tends to stop falling and reverse, while resistance indicates a level where the price often halts its ascent.
These levels offer insights into potential entry (buy) and exit (sell) points.
[READ: Everything to Know about Support and Resistance Levels]
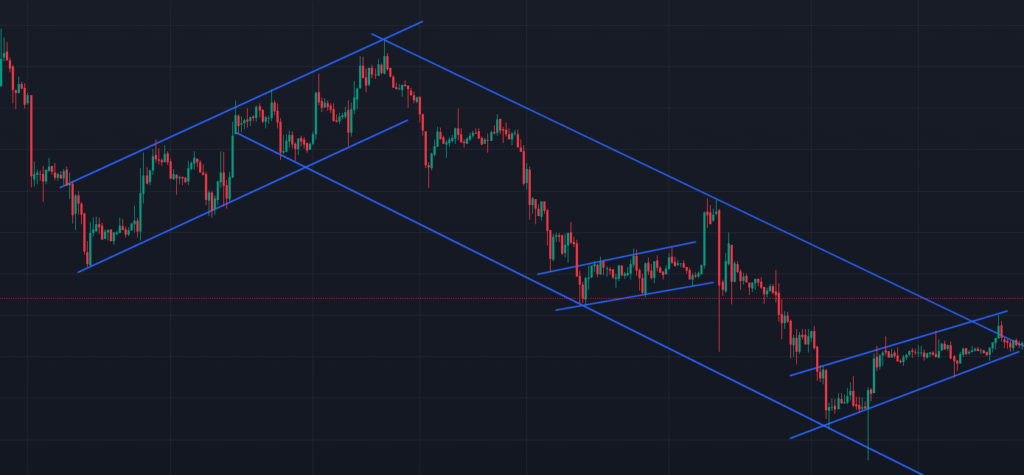
6. Chart Patterns
These artistic formations on price charts reveal the intricate dance between buyers and sellers.
Patterns like “head and shoulders,” “double tops,” and “flags” provide visual cues of potential trend reversals or continuations.
7. Fibonacci Retracement
Named after the famous mathematician, Fibonacci retracement levels help identify potential support and resistance zones based on specific percentage retracements of a prior price move.
Traders use these levels to anticipate where prices might reverse or consolidate.
8. Volume Analysis
Just as the strength of ocean currents impacts navigation, trading volume reveals the intensity of market participation.
High volume during price movements can confirm trends, while low volume may indicate potential reversals.
These tools collectively form the palette of a technical analyst, allowing them to paint a vivid picture of a cryptocurrency’s price behavior.
By studying these patterns and indicators, traders can gain insights into potential future price movements and make informed decisions.
Benefits of Technical Analysis in Crypto Trading
In the fast-paced and often unpredictable crypto trading world, having a strategic edge is crucial for success.
This is where crypto technical analysis shines, offering traders a robust toolkit to navigate the complexities of cryptocurrency markets.
Let’s delve into the tangible benefits that technical analysis brings to the table in crypto trading:
1. Increased Probability of Identifying Trends and Patterns
Imagine you’re watching the waves of an ocean.
Sometimes they’re calm and predictable, while other times they form mighty swells.
Similarly, price charts reveal trends that can be as soothing as a gentle breeze or as tumultuous as a stormy sea.
Crypto technical analysis equips traders with the ability to identify these trends and patterns, giving them an edge in predicting future price movements.
Whether it’s a bullish uptrend that’s aiming for the skies or a bearish downtrend that’s testing the waters, recognizing these patterns helps traders ride the waves and time their trades strategically.
These patterns go beyond mere lines on a chart; they are the whispers of market dynamics, telling traders stories of supply and demand, investor sentiment, and potential turning points.
Armed with this knowledge, traders can make decisions that are grounded in analysis rather than relying solely on gut feelings.
2. Objective Approach to Decision-Making
Technical analysis relies on data and chart patterns rather than emotions, offering a more objective way to assess market conditions and make trading decisions.
Emotion-driven decisions often lead to costly mistakes.
[READ: 7 Common Mistakes Crypto Traders and Investors Make Often]
3. Timing Entries and Exits
By analyzing historical price data, technical analysis helps traders time their entry and exit points more effectively.
This can enhance profitability and minimize losses in crypto trading.
4. Potential to Manage Risk
Crypto technical analysis provides tools to set stop-loss orders and manage risk.
Traders can identify key support and resistance levels to define risk parameters and protect their investments.
5. Confirmation of Fundamental Analysis
Crypto technical analysis can complement fundamental analysis by confirming or contradicting the signals derived from fundamental factors.
This synergy can provide traders with a more comprehensive view of market trends.
6. Visual Representation of Market Psychology
Chart patterns and indicators visually represent the collective psychology of market participants.
Traders can gain insights into market sentiment and potential price reversals or continuations.
7. Historical Performance and Success Stories
Many successful traders and investors attribute their achievements to technical analysis.
Historical data showcases instances where technical analysis effectively predicted market movements.
Challenges and Limitations of Technical Analysis in Crypto Trading
While crypto technical analysis is a valuable tool for deciphering market trends and making informed trading decisions, it’s important to acknowledge that no approach is without its challenges and limitations.
The dynamic and often unpredictable nature of cryptocurrency markets introduces several factors that traders should consider when relying on technical analysis.
Let’s delve into some of the challenges and limitations of using technical analysis in crypto trading:
1. False Signals and Whipsaws
Crypto technical analysis tools, like any analytical method, can produce false signals.
A false signal occurs when an indicator suggests a certain price movement that doesn’t materialize.
Whipsaws, where prices quickly reverse after signaling a move, can lead to losses for traders who act on these signals without caution.
[READ: How to Avoid Losing Money in Crypto Trading]
2. Over-Reliance on Historical Data
Crypto technical analysis heavily relies on historical price data to predict future movements.
However, crypto markets are influenced by rapidly changing news, regulations, and technological developments that historical data may not fully capture.
3. Lack of Fundamental Analysis
Technical analysis primarily focuses on price and volume data, often ignoring the underlying fundamental factors that can drive market movements.
Ignoring fundamental analysis could lead to misinterpretation of market trends.
4. Subjectivity in Interpretation
Interpretation of chart patterns and indicators can be subjective, leading to different conclusions among traders.
This subjectivity may result in varied trading decisions and outcomes.
5. Market Manipulation and Illiquidity
Crypto markets are relatively young and can be susceptible to market manipulation.
Illiquid markets may exhibit exaggerated price movements, making technical analysis less reliable in such conditions.
6. Rapidly Changing Trends
Cryptocurrency markets can exhibit rapid and unpredictable shifts in trends due to evolving technologies, adoption rates, and market sentiment.
These sudden changes can challenge the effectiveness of established technical analysis strategies.
To mitigate these challenges, many successful traders combine technical analysis with other approaches, such as fundamental analysis and sentiment analysis.
Additionally, risk management strategies, like setting stop-loss orders and position sizing, can help minimize potential losses resulting from false signals or unexpected market events.
How to Develop a Technical Analysis Strategy in Crypto Trading
Navigating the dynamic and often turbulent waters of crypto trading requires a well-defined plan.
A carefully crafted technical analysis strategy can provide traders with a systematic approach to harnessing the power of market trends and patterns.
Let’s delve into the process of developing an effective technical analysis strategy tailored to the unique characteristics of the cryptocurrency landscape:
1. Define Your Goals and Risk Tolerance
Clearly outline your trading goals, whether they involve short-term gains, long-term investments, or a combination of both.
Determine your risk tolerance, setting limits on potential losses for each trade and overall portfolio.
2. Gather Data
Collect historical price and trading volume data for your chosen crypto asset.
You can find this data on reliable crypto exchanges like Binance, Bybit, Kucoin, or Gate.io, or through charting platforms like TradingView.
3. Choose a Timeframe
Select a timeframe that aligns with your trading style and goals.
Are you a day trader looking for quick profits, a swing trader capturing short-term trends, or an investor seeking long-term growth?
Different timeframes require different technical tools and approaches.
4. Select Key Technical Indicators
Based on your chosen timeframe, identify a set of technical indicators that align with your trading objectives.
Consider using a combination of indicators to validate signals and reduce the risk of false alarms.
5. Understand Chart Patterns
Familiarize yourself with common chart patterns like triangles, flags, and double tops.
Learn to recognize these patterns and understand their potential implications for future price movements.
[READ: How to Use Candlestick Charts to Identify Trading Opportunities]
6. Identify Support and Resistance Levels
Locate key support and resistance levels on the price chart.
These levels often play a significant role in price movements and can guide your entry (buy) and exit (sell) decisions.
7. Develop Entry and Exit Strategies
Define clear criteria for entering and exiting trades.
Determine when to buy (enter) and sell (exit) based on the signals provided by your selected indicators and patterns.
8. Backtesting and Optimization
Test your strategy on historical price data to assess its performance.
Refine your strategy based on the results of backtesting and optimize parameters to enhance its effectiveness.
9. Incorporate Risk Management
Integrate risk management techniques such as setting stop-loss orders, position sizing, and diversification.
These measures help protect your capital and mitigate potential losses.
10. Monitor and Adapt
Continuously monitor the performance of your strategy and be prepared to adapt to changing market conditions.
Markets evolve, and your strategy should be flexible enough to accommodate new trends and developments.
11. Combine with Fundamental Analysis
While focusing on technical analysis, consider incorporating fundamental analysis to gain a holistic view of the market.
Fundamental factors, such as adoption rates, regulatory changes, and technological advancements, can significantly impact crypto prices.
12. Embrace Patience and Discipline
Successful crypto trading requires patience and discipline.
Avoid making impulsive decisions based on emotions.
Stick to your strategy and resist the temptation to deviate from your plan.
Conclusion
In wrapping up, don’t let the complexities of technical analysis intimidate you – think of it as your trusty first mate, guiding you towards potential profits while helping you avoid treacherous pitfalls.
Remember, just as seasoned sailor relies on their compass to navigate the vast seas, savvy crypto trader leans on technical analysis to chart their course through the volatile crypto waters.
So, as you embark on your own crypto trading journey, keep in mind the pearls of wisdom shared within this blog post.
Because armed with the power of technical analysis, you can decipher the intricate patterns and trends that might have otherwise gone unnoticed.
It is your secret decoder for the crypto market’s hidden messages.
Additional Resources
To help you get better with Bitcoin and cryptocurrencies we have prepared additional resources below which we believe you will find useful.
But before you check them out, kindly visit our Instagram and Twitter pages, to join us for more content.
Additional Resources:
- How to Start Trading Crypto as a Beginner
- How to Read Cryptocurrency Candlestick Charts Like a Pro
- 5 Best Indicators for Crypto Trading
- Everything to Know about Risk Management in Crypto Trading
- 5 Best Crypto Exchanges You Should Use
- 7 Best Ways to Protect Your Cryptocurrencies from Theft and Hacks

IMPORTANT; you must never send money to anyone you meet online asking to help you invest in cryptocurrency. They are scammers. Crypto is easy, and you can do it all by yourself.
DISCLAIMER:
The information provided here is intended for informational purposes only and should not be solely relied upon for making investment decisions. It does not constitute financial, tax, legal, or accounting advice. Additionally, I strongly recommend that you only invest in cryptocurrency an amount you are comfortable with potentially losing temporarily.