
Understanding support and resistance in crypto trading is an absolute must, especially if you’re looking to enhance your trading skills and become a profitable cryptocurrency trader.
By understanding the support and resistance levels, you gain insights into where prices might find stability or encounter resistance, ultimately empowering you to know where to buy or sell crypto.
So, today, we’re going to unravel the secrets of “support” and “resistance” and how mastering these concepts can give you the upper hand in the wild roller coaster ride that is crypto trading.
Whether you’re a seasoned trader or just dipping your toes into the crypto waters, understanding support and resistance is a must.
So, grab your favorite mug of coffee, sit back, and let’s embark on a conversational journey to demystify the ins and outs of support and resistance in crypto trading.
Trust me, by the end of this post, you’ll be armed with valuable knowledge to know exactly when to buy and sell crypto for profit like a pro!
What are Support and Resistance Levels
Support and resistance levels are like the foundation and ceiling of a house, playing a vital role in determining the price movement of cryptocurrencies.
Support levels act as sturdy floors beneath the price, preventing it from falling further.
They represent areas where buying pressure outweighs selling pressure, causing the price to bounce back up.
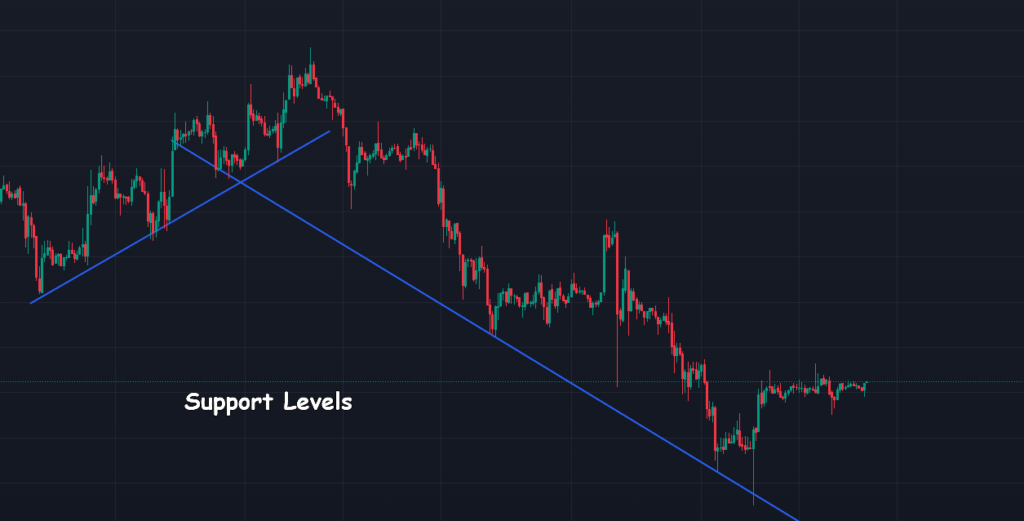
Think of it as a safety net that catches the price when it’s about to drop too low.
Traders often view support levels as attractive buying opportunities, anticipating a potential price reversal.
On the other hand, resistance levels are like stubborn ceilings that restrict the price from rising higher.
These levels signify areas where selling pressure exceeds buying pressure, creating a barrier that prevents the price from soaring.
When the price reaches a resistance level, it tends to encounter selling pressure, causing it to reverse its upward trajectory.
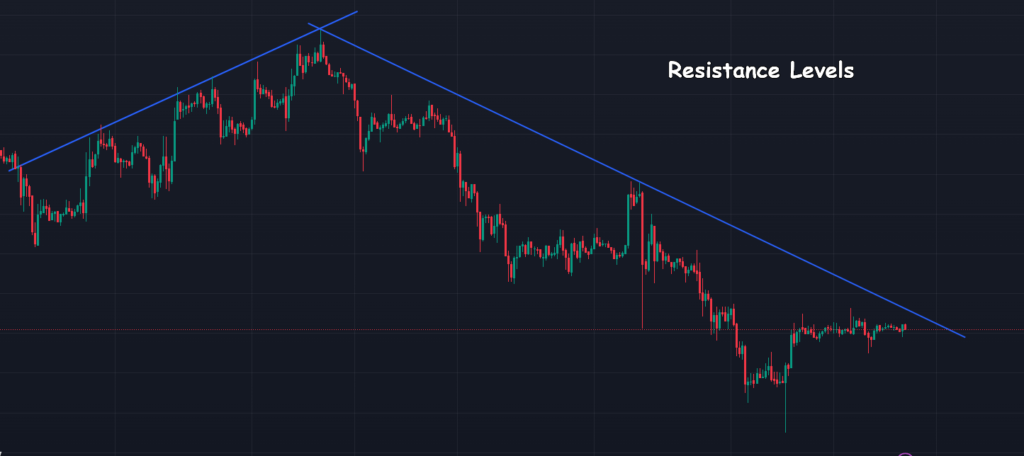
Traders often see resistance levels as potential selling points or areas where they might consider shorting a cryptocurrency.
To put it simply, support and resistance levels are key price zones that act as natural barriers in the market.
They reflect the collective decisions of traders and investors and can provide valuable insights into the supply and demand dynamics of a particular cryptocurrency.
By understanding support and resistance levels, you can anticipate potential price movements, plan your trades strategically, and effectively manage your risk.
How to Identify Support and Resistance Levels
Now that we understand support and resistance levels, let’s uncover the methods for identifying these crucial zones in crypto.
1. Historical Price Data
One effective way to identify support and resistance levels is by studying historical price data.
Look for price levels where the cryptocurrency has previously struggled to break through (resistance) or where it has consistently found support and bounced back (support).
These historical levels often leave footprints on the charts, guiding future price movements.
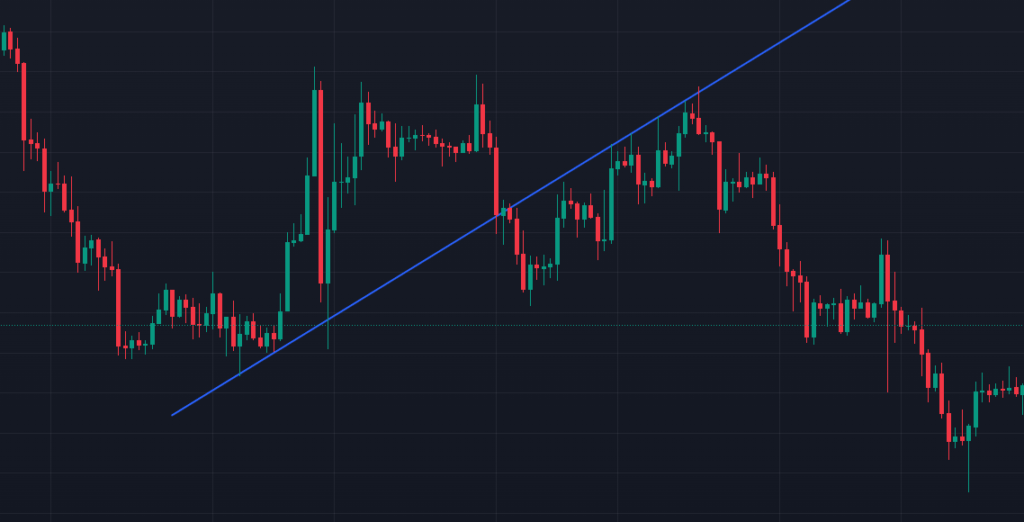
2. Trendlines
Trendlines are powerful tools for identifying support and resistance levels.
By drawing a line connecting the successive higher lows in an uptrend or lower highs in a downtrend, you can visualize the support or resistance levels that align with the trend.
These trendlines act as dynamic support or resistance, signaling potential reversal points.
3. Moving Averages
Moving averages are widely used indicators that help identify support and resistance levels.
The 50-day and 200-day moving averages are commonly watched by traders.
When the price approaches or crosses these moving averages, they can act as support or resistance, respectively, depending on the direction of the price movement.
4. Pivot Points
Pivot points are calculated using previous high, low, and closing prices.
They provide potential levels of support and resistance for the upcoming trading session.
Traders often use pivot points to determine key price levels to watch for potential reversals or breakouts.
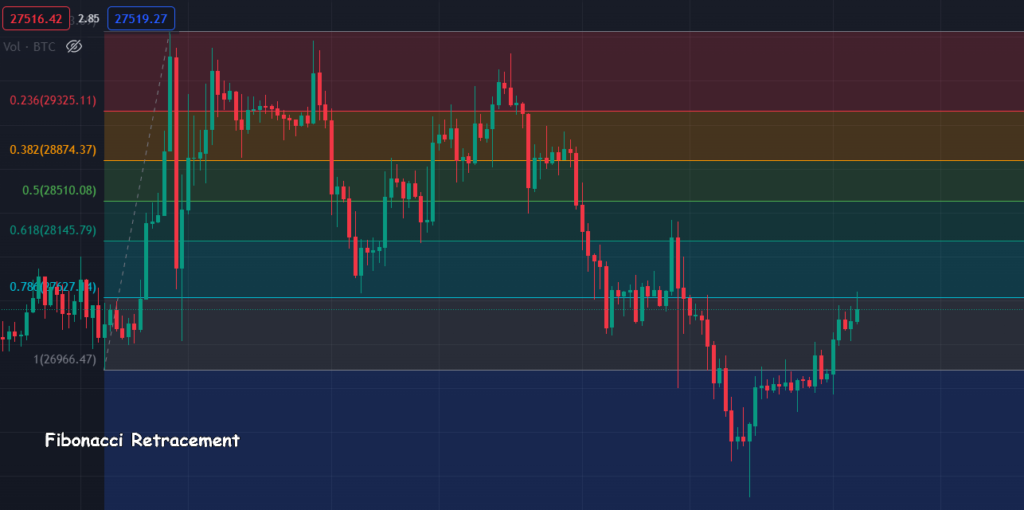
5. Fibonacci Retracement
Fibonacci retracement levels are based on mathematical ratios derived from the Fibonacci sequence.
These levels help identify potential support and resistance zones based on the percentage retracement of a prior price move.
Traders often use Fibonacci retracement levels to gauge where the price might find support or face resistance during a correction.
[READ: How You Can Become Successful in Cryptocurrency]
The Psychology Behind Support and Resistance
Understanding the psychology behind support and resistance levels can provide valuable insights into market dynamics and help us navigate the crypto market more effectively.
1. Market Memory
Support and resistance levels have psychological significance because they reflect market memory.
Traders and investors remember previous price levels where significant buying or selling pressure emerged.
When the price approaches these levels again, market participants often react based on their previous experiences, leading to predictable price behaviors.
2. Fear and Greed
The emotions of fear and greed play a significant role in shaping support and resistance levels.
Fear can drive selling pressure as traders rush to exit positions, causing the price to break below support levels.
Conversely, greed can fuel buying pressure as traders anticipate further price gains, resulting in the price encountering resistance levels.
Understanding these emotional factors can help traders anticipate potential reactions at key price zones.
3. Supply and Demand
Support and resistance levels also reflect the basic principles of supply and demand.
Support levels form when buying demand outweighs selling pressure, indicating a willingness to buy at certain prices.
Conversely, resistance levels form when selling pressure surpasses buying demand, suggesting a willingness to sell at specific prices.
These levels represent zones where the forces of supply and demand intersect.
4. Role Reversal
Another intriguing aspect of support and resistance psychology is the phenomenon of role reversal.
Once a support level is breached, it often flips its role and becomes a resistance level.
Similarly, when a resistance level is broken, it may transform into a support level.
This shift occurs due to market participants’ psychological reaction to these levels, creating new trading opportunities.
By delving into the psychology behind support and resistance, we gain a deeper understanding of why these levels hold significance in the market.
They reflect the collective decisions, emotions, and expectations of traders and investors.
[READ: 7 Common Mistakes Crypto Investors and Traders Make]
Using Support and Resistance in Crypto Trading Strategies
Now that you have a solid understanding of support and resistance levels and their psychological underpinnings, it’s time to chart our course toward practical applications.
Let’s explore how we can harness the power of support and resistance in our crypto trading strategies;
1. Breakout Trading
Breakout trading involves entering a trade when the price breaks above a resistance level or below a support level.
This strategy assumes that once a level is broken, it indicates a significant shift in market sentiment and potentially leads to a sustained price movement in the breakout direction.
Traders often place their entry orders slightly above the resistance level or below the support level to confirm the breakout.
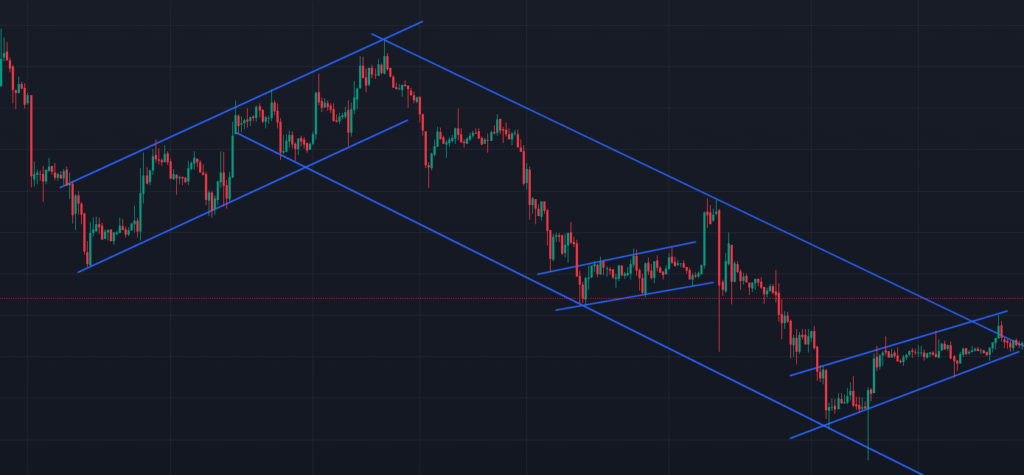
2. Range Trading
Range trading involves identifying key support and resistance levels that contain the price within a defined range.
Traders aim to buy near support and sell near resistance, taking advantage of the price bouncing between these levels.
This strategy requires monitoring price movements within the range, looking for signs of reversal or exhaustion near the support or resistance levels.
3. Support/Resistance Flips
As mentioned earlier, support and resistance levels can undergo role reversals when breached.
Traders can capitalize on this by observing significant support levels that have been broken and then retested as resistance, or vice versa.
If a support level flips to resistance, traders may consider entering short positions when the price approaches the former support-turned-resistance level, expecting further downside movement.
4. Confirmation Indicators
To increase the accuracy of support and resistance analysis, traders often use confirmation indicators.
These include trendlines, moving averages, volume analysis, or other technical indicators.
The idea is to seek alignment between these indicators and the identified support or resistance levels, providing additional confidence in the trading decision.
5. Risk Management
No trading strategy is complete without sound risk management.
When incorporating support and resistance levels into your trading plan, set appropriate stop-loss orders to limit potential losses if the price breaks through a critical level.
Additionally, consider setting profit targets based on nearby resistance levels or adjusting them as the price progresses.
Remember, every strategy has its strengths and weaknesses.
It’s essential to test and refine your approach based on your risk tolerance, trading style, and market conditions.
Potential Limitations and Challenges
It’s crucial to be aware of potential limitations and challenges when using support and resistance in your crypto trading.
So, let’s navigate through these waters together to ensure a well-rounded understanding.
1. False Breakouts or Breakdowns
One of the primary challenges traders face is the occurrence of false breakouts or breakdowns.
Sometimes, the price may temporarily breach a support or resistance level, only to quickly reverse and continue in the opposite direction.
False signals can lead to losses if traders enter positions based solely on these initial price movements.
It’s important to wait for confirmation signals and consider using additional indicators to validate a breakout or breakdown.
2. Dynamic Nature of Support and Resistance
Support and resistance levels are not fixed in stone.
They evolve over time as market conditions change.
Traders need to adapt and reassess these levels as new price data emerges.
What was a strong support or resistance level in the past may not hold up in the future.
Stay vigilant and regularly update your analysis to reflect the latest market developments.
3. Overlapping Levels and Cluttered Charts
Crypto charts can become cluttered with numerous support and resistance levels, making it challenging to identify the most significant ones.
It’s crucial to prioritize the levels that have demonstrated greater historical significance and align with other technical indicators.
Too many overlapping levels can lead to confusion and hinder decision-making.
4. Market Manipulation and Whipsaws
The crypto market, like any other financial market, can be susceptible to market manipulation and sudden price movements designed to trap unsuspecting traders.
These “whipsaws” can result in false breakouts or breakdowns, causing traders to enter trades based on erroneous signals.
Exercise caution, be aware of market dynamics, and consider using multiple confirmation indicators to minimize the impact of such events.
[READ: 5 Common Crypto Scams and How to Avoid Them]
5. Additional Tools and Analysis
While support and resistance levels are essential components of technical analysis, relying solely on them may limit your trading perspective.
Consider complementing your analysis with other tools, such as trendlines, chart patterns, volume analysis, or oscillators.
A comprehensive approach that combines multiple indicators can provide a more holistic view of the market and enhance your trading decisions.
Conclusion
And there you have it — a comprehensive guide to understanding support and resistance in crypto trading!
By now, you should have a solid grasp of how support and resistance levels function in the crypto world.
Remember, support acts as a safety net, preventing prices from falling further, while resistance acts as a barrier, impeding upward price movements.
Recognizing these levels can help you to know the perfect time to buy or sell a cryptocurrency for profit.
However, keep in mind that support and resistance alone won’t guarantee success in your trading endeavors.
It’s essential to combine this knowledge with other technical and fundamental analysis tools, as well as develop a sound risk management strategy.
Trading requires a holistic approach, and continuously educating yourself and adapting to market trends will play a crucial role in your long-term success.
I hope you found this guide helpful.
So, get out there and start applying your newfound knowledge!
I have also written some other crypto blog posts that will help you in your cryptocurrency journey.
Check them below.
You should also check us out on Twitter and Instagram to follow us and stay up-to-date with the industry.
read also:
- How to Avoid Losses in Bitcoin Trading
- 5 Top Crypto Exchanges for Trading Cryptocurrencies
- How to Read Crypto Candlestick Charts Like a Pro
- Why You Keep Losing Money in Crypto
- How to Use Candlestick Charts to Identify Trading Opportunities in The Crypto Market

IMPORTANT; you must never send money to anyone you meet online asking to help you invest in cryptocurrency. They are scammers. Crypto is easy, and you can do it all by yourself.
DISCLAIMER:
The information presented here should not be used as the sole basis of any investment decisions, nor should it be construed as financial, tax, legal, or accounting advice. I will also advise that you invest in cryptocurrency only what you are comfortable living without, at least temporarily.