
Welcome to this post on how to use candlestick charts to identify trading opportunities in the crypto market.
Maybe in the past, you have found yourself struggling to understand market trends or identify profitable trading opportunities in the crypto market.
That’s where candlestick charts come in.
If you’re not familiar with this powerful tool, you’re missing out on a game-changer in the world of crypto trading.
Candlestick charts are an important tool for technical analysis in trading.
They have been used by traders for centuries, and for good reasons.
Candlestick charts provide a clear, easy-to-understand visualization of price movements over time, making it easier to spot patterns and identify trading opportunities.
In this post, we will dive into the world of candlestick charts and show you how to use them to your advantage.
Whether you’re a seasoned trader or just starting out, this guide will equip you with the knowledge you need to make informed trading decisions and take your crypto game to the next level.
By the end of this post, you should have a good understanding of how to use candlestick charts to improve your trading strategy in the crypto market.
So, let’s get started!
Using Candlestick Charts to Identify Trading Opportunities
Candlestick charts are a valuable tool for identifying trading opportunities in the crypto market.
Here are some ways to use candlestick charts to help inform your trading decisions:
1. Identifying Trends
One of the primary uses of candlestick charts is to identify trends in price movements.
A trend can be either bullish or bearish, and it can be short-term or long-term.
By identifying trends, traders can anticipate future price movements and adjust their trading strategies accordingly.
To identify trends, look for a series of candlesticks that are predominantly bullish (green or white) or bearish (red or black).
In an uptrend, the price consistently makes higher highs and higher lows.
In a downtrend, the price consistently makes lower highs and lower lows.
[READ: What is Bullish in Crypto Market?]
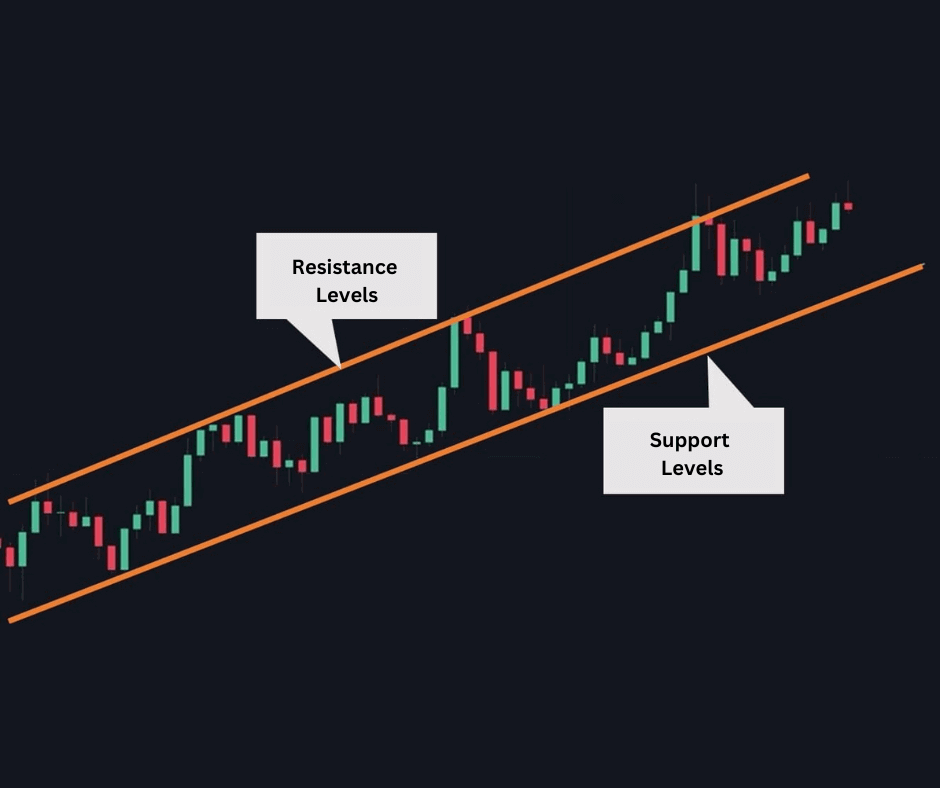
2. Identifying Support and Resistance Levels
Support and resistance levels are price levels at which the market tends to experience buying or selling pressure.
Support levels are where the price tends to find support and bounce back up, while resistance levels are where the price tends to encounter selling pressure and fall back down.
To identify support and resistance levels, look for areas where the price has previously bounced off or struggled to break through.
These levels can be identified by looking for patterns such as horizontal lines or trendlines on the chart.
3. Identifying Entry and Exit Points
Once you have identified a trend and support and resistance levels, you can use candlestick patterns to help determine when to enter or exit a trade.
For example, a bullish engulfing pattern can signal a potential reversal from a downtrend to an uptrend, while a bearish engulfing pattern can signal a potential reversal from an uptrend to a downtrend.
By using candlestick charts to identify trends, support and resistance levels, and entry and exit points, traders can gain a better understanding of the market and make more informed trading decisions.
How to Use Candlestick Charts to Identify Trading Opportunities in the Crypto Market
Here is everything you should follow to identify trading opportunities in crypto using candlestick charts;
1. Understand the basics of candlestick charting
Candlestick charts display the price movement of an asset over a specific period, usually a day or a week.
Each candlestick represents open, high, low, and close prices for that period.
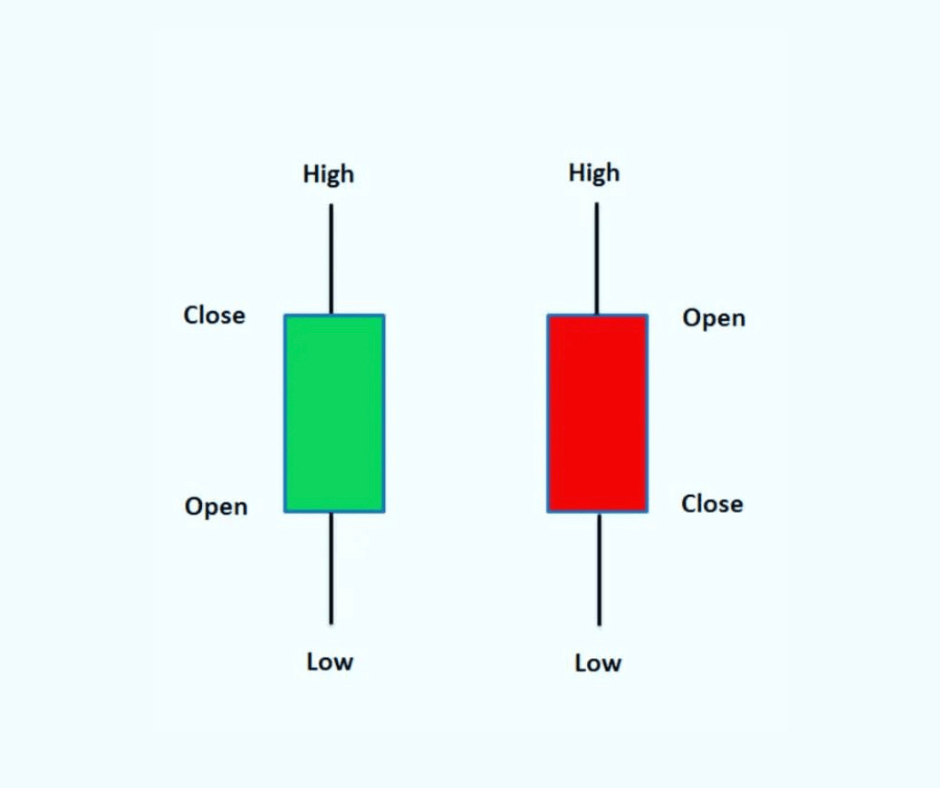
The body of the candlestick represents the opening and closing prices, while the wicks or shadows represent the high and low prices.
2. Pay attention to the size of the candlesticks
The size of the candlesticks can provide important information about the strength of the price movement.
Large candlesticks typically indicate strong buying or selling pressure, while small candlesticks indicate indecision or a lack of momentum.
3. Combine different timeframes
To get a complete picture of the market, consider looking at candlestick charts with different timeframes.
Different timeframes, such as hourly, daily, weekly, and monthly, to get a better understanding of the overall trend.
For example, if the daily chart shows a bullish pattern but the weekly chart shows a bearish pattern, it may be better to wait for further confirmation before entering a trade.
A trader can also use a daily chart to identify long-term trends and a 1-hour or 4-hour chart to identify short-term trading opportunities.
4. Look for patterns
One of the most important aspects of candlestick charting is identifying patterns.
These patterns are what help you in identifying potential trading opportunities.
Some common patterns include the bullish engulfing pattern, bearish engulfing pattern, and hammer pattern.
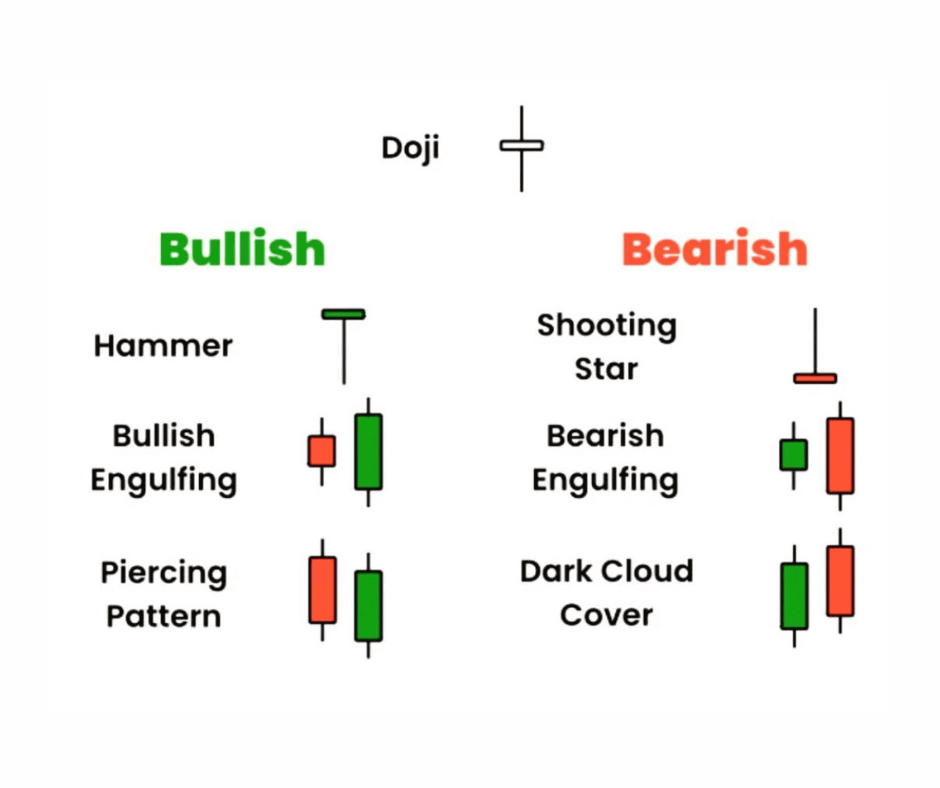
These patterns can indicate changes in the direction of the market, which can be a signal to enter or exit a trade.
5. Identify support and resistance levels
Support and resistance levels are areas where the price of an asset has historically bounced off or reversed.
These levels can be identified by looking for areas where the price has previously stalled or reversed.
When combined with candlestick patterns, these levels can be useful in identifying when to enter or exit a trade.
6. Use indicators
Candlestick charts are just one tool in your trading toolbox.
You should also use technical indicators, such as moving averages and relative strength index (RSI), to complement your analysis of candlestick charts.
These indicators can help you confirm or refute the signals provided by candlestick patterns.
7. Practice and refine your strategy
It takes time and experience to become proficient at using candlestick charts to identify trading opportunities.
You can start by practicing with a demo account and refine your strategy over time as you gain more experience and knowledge.
Tips for Effective Candlestick Chart Analysis
Here are 2 tips for candlestick chart analysis in the crypto market:
1. Keep an Eye on News and Events
While candlestick charts can provide valuable insights into market trends and patterns, they don’t exist in a vacuum.
It’s important to stay up-to-date on news and events that could impact the market, such as regulatory changes or major corporate announcements.
By combining technical analysis with fundamental analysis, traders can make more informed trading decisions.
2. Practice Good Risk Management
As with any trading strategy, it’s important to practice good risk management when using candlestick charts.
This means setting stop-loss orders to limit potential losses and avoiding over-leveraging positions.
By managing risk effectively, traders can minimize their losses and maximize their profits over the long term.
related:
Conclusion
While there is no magic formula for trading in the crypto market, using candlestick charts can give you a significant advantage.
They are a powerful tool that can help traders identify potential opportunities in the volatile crypto market.
By understanding the different patterns and signals that can be observed on these charts, you can make more informed decisions about when to buy, sell, or hold your cryptocurrency investments.
So, whether you’re a beginner or a seasoned pro, incorporating this tool into your trading strategy could be the key to unlocking your full potential in the crypto world.
Additional Resources
To help you get better with Bitcoin and cryptocurrencies we have prepared additional resources below which we believe you will find useful.
But before you check them out, kindly visit our Instagram and Twitter pages, to join us for more content.
Additional Resources:
- Best Crypto Exchanges for Trading Cryptocurrencies
- 7 Top Ways to Secure Your Cryptocurrency
- Best Stablecoins To Use
- 7 Common Mistakes Crypto Investors and Traders Make

IMPORTANT; you must never send money to anyone you meet online asking to help you invest in cryptocurrency. They are scammers. Crypto is easy, and you can do it all by yourself.
DISCLAIMER:
The information presented here should not be used as the sole basis of any investment decisions, nor should it be construed as financial, tax, legal, or accounting advice. I will also advise that you invest in cryptocurrency only what you are comfortable living without, at least temporarily.