For crypto traders seeking the keys to success, here are the top 5 indicators for crypto trading.
Are you ready?
To dive into the exciting world of crypto trading and boost your financial potential?
Well, you’re in luck because, in this electrifying blog post, we’ll be uncovering the top 5 indicators that can make a real difference in your crypto trading game.
Whether you’re a seasoned trader looking to fine-tune your strategies or a beginner eager to make your mark, these top indicators are your secret weapons to success.
Picture this: you’re sitting at your desk, sipping your favorite drink, and effortlessly making good trading decisions while others struggle to keep up.
Sound like a dream?
It’s time to turn that dream into reality.
Gone are the days of second-guessing, sleepless nights, and missed opportunities.
By understanding and effectively utilizing the right indicators, you’ll gain the upper hand in this fast-paced and ever-changing market.
So, brace yourself for a riveting journey where you’ll acquire the tools to transform your financial destiny, forever altering the course of your life.
Get ready to witness your trading prowess skyrocket as you harness the power of these game-changing indicators.
I have meticulously curated this guide to ensure that you not only understand them but wield them like a seasoned pro.
So, let’s embark on this thrilling adventure together and unlock the secrets that will catapult you to the top of the crypto trading elite.
Get ready to redefine what’s possible – your journey to unparalleled success starts now!
What are Indicators in Crypto Trading
Indicators in crypto trading refer to mathematical calculations or visual representations derived from market data that help traders analyze and interpret market trends, patterns, and potential trading opportunities.
These indicators provide quantitative insights into price movements, volume, and momentum of cryptocurrencies.
The purpose of indicators is to assist traders in making good decisions by providing objective and data-driven signals.
They serve several key purposes:
1. Analyzing Market Trends
Indicators help identify and confirm market trends, whether they are bullish (upward), bearish (downward), or range-bound (sideways).
They provide visual representations or numerical values that highlight the prevailing direction and strength of the market.
2. Predicting Price Movements
By analyzing historical price data and applying mathematical formulas, indicators can help predict potential future price movements.
They provide traders with signals indicating when prices might reverse, continue a trend, or enter a period of consolidation.
3. Timing Entry and Exit Points
Top indicators assist traders in determining optimal entry and exit points for trades.
They can identify potential buy or sell signals based on specific conditions, such as overbought or oversold levels, price crossovers, or divergence between price and indicator movements.
4. Risk Management
Indicators aid in assessing and managing risk.
They provide insights into market volatility, potential support and resistance levels, and the strength of price movements.
Traders can use this information to set stop-loss orders, determine position sizes, and adjust risk-reward ratios.
[Also read: Understanding Support and Resistance in Crypto Trading]
Top 5 Indicators for Crypto Trading
Below are the top 5 indicators for crypto trading success:
1. Moving Averages: Riding the Trends
When it comes to crypto trading, one of the top indicators you need to know about is the moving average.
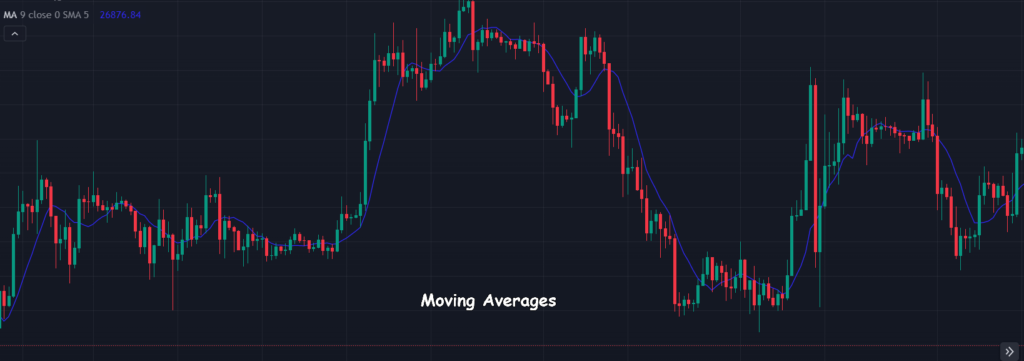
This simple yet powerful tool helps traders identify trends and potential entry or exit points.
So, what exactly is a moving average?
Well, it’s a calculation that averages out the price of a cryptocurrency over a specific period.
This average is then plotted on a chart, creating a line that smooths out the price movements and reveals the overall trend.
Moving averages come in different flavors, but the two most commonly used are the simple moving average (SMA) and the exponential moving average (EMA).
The SMA calculates the average price over a fixed number of periods, while the EMA gives more weight to recent prices, making it more responsive to changes.
By using moving averages, traders can spot trends in the market.
For example, if the price of a cryptocurrency is consistently trading above its moving average, it suggests an uptrend.
Conversely, if the price is consistently trading below the moving average, it indicates a downtrend.
These trends can be further analyzed by looking at the relationship between multiple moving averages.
When a shorter-term moving average crosses above a longer-term moving average, it’s called a “golden cross” and is often seen as a bullish signal.
On the other hand, when a shorter-term moving average crosses below a longer-term moving average, it’s called a “death cross” and is considered a bearish signal.
Moving averages also help traders determine potential entry and exit points.
For example, a trader might look for a pullback to the moving average as a buying opportunity during an uptrend.
Similarly, during a downtrend, a bounce off the moving average could be an opportunity to sell or short the cryptocurrency.
Moving averages provide a solid foundation for understanding and identifying trends in the crypto market.
So, don’t overlook the power of moving averages in your trading toolkit.
2. Relative Strength Index (RSI): Gauging Market Momentum
In the fast-paced world of crypto trading, it’s crucial to have a tool that helps you gauge market momentum and identify potential price reversals.
This is where the Relative Strength Index (RSI) comes into play.
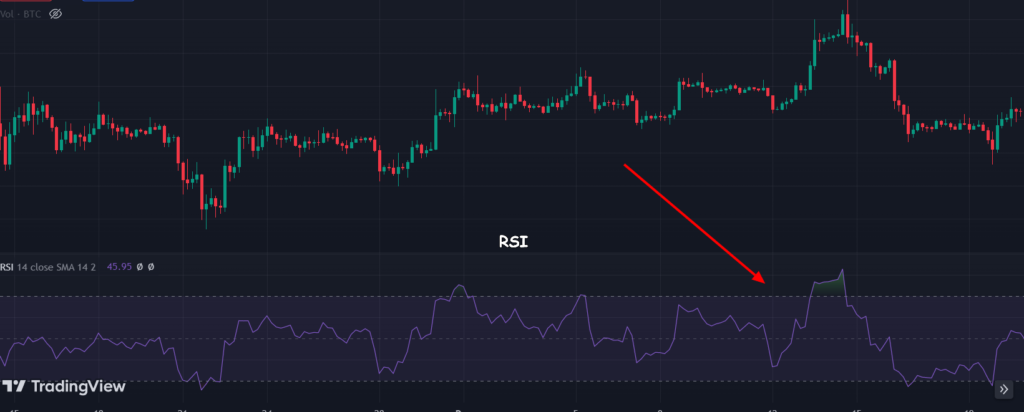
The RSI is a popular indicator used by crypto traders to measure the strength and speed of price movements in a cryptocurrency.
It operates on a scale of 0 to 100 and provides insights into whether a cryptocurrency is overbought or oversold.
So, how does the RSI work?
The RSI compares the magnitude of recent price gains to recent price losses and generates a value that oscillates between the 0 and 100 levels.
A reading above 70 typically suggests that a cryptocurrency is overbought, meaning it may be due for a price correction or a period of consolidation.
Conversely, a reading below 30 indicates that a cryptocurrency is oversold, signaling a potential buying opportunity.
It’s important to note that the RSI is most effective when combined with other indicators or used in conjunction with support and resistance levels.
For example, if a cryptocurrency’s price reaches a significant resistance level and the RSI is above 70, it could indicate a potential price reversal or a pullback.
Another way to use the RSI is by looking for divergences.
A bullish divergence occurs when the price of a cryptocurrency forms a lower low while the RSI forms a higher low.
This suggests that despite the price trending down, the selling pressure is weakening, indicating a potential upward reversal.
Similarly, a bearish divergence occurs when the price forms a higher high while the RSI forms a lower high, indicating a potential downward reversal.
Remember, the RSI is not a standalone indicator.
It works best when combined with other tools and analysis techniques.
By incorporating the RSI into your trading strategy, you can gain valuable insights into market momentum, identify overbought and oversold conditions, and potentially anticipate price reversals.
3. Bollinger Bands: Understanding Volatility
Volatility is a key aspect of the cryptocurrency market, and understanding it can help traders make better decisions.
One top indicator that can assist in assessing volatility and potential price breakouts is Bollinger Bands.
Bollinger Bands are comprised of three lines plotted on a price chart.
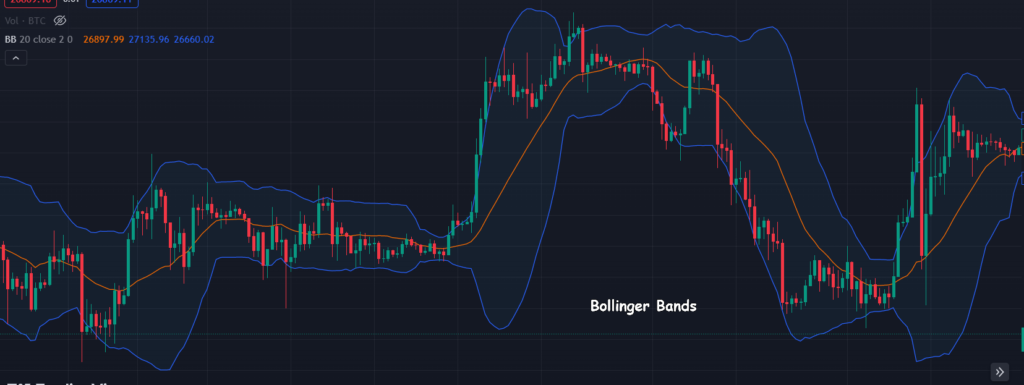
The middle line is a simple moving average (usually 20 periods), while the upper and lower bands are calculated based on standard deviations from the moving average.
These bands visually represent price volatility and provide insights into potential price movements.
When the price of crypto is in a period of low volatility, the Bollinger Bands will contract, and the distance between the upper and lower bands will narrow.
This suggests a period of consolidation or range-bound trading.
Conversely, when volatility increases, the bands expand, indicating potential price breakouts or trending market conditions.
Traders can use Bollinger Bands in various ways.
One strategy involves looking for price action near the bands.
For example, when the price approaches the upper band, it may suggest that the crypto is overbought, potentially indicating an upcoming pullback or a reversal.
Similarly, when the price touches the lower band, it may signal oversold conditions, potentially presenting a buying opportunity.
Another way to utilize Bollinger Bands is by paying attention to price breakouts.
When the price breaks out of the upper or lower band, it can indicate the start of a new trend or a continuation of an existing one.
Traders often combine Bollinger Bands with other indicators, such as the Relative Strength Index (RSI), to confirm potential breakouts.
It’s important to note that Bollinger Bands are not foolproof, and false signals can occur.
Therefore, it’s crucial to use them in conjunction with other indicators and analysis techniques.
By understanding Bollinger Bands and incorporating them into your trading strategy, you can gain insights into volatility, identify potential price breakouts, and make more informed decisions.
[READ: Why You Lose Money in Crypto Market]
4. Volume: Uncovering Market Interest
When it comes to analyzing the crypto market, one top indicator that traders rely on is volume.
The volume provides insights into the level of market interest and liquidity for a particular cryptocurrency.
By understanding volume patterns, traders can gain a deeper understanding of price movements and make good trading decisions.
So, what exactly is volume?
In simple terms, the volume represents the number of shares or units of a cryptocurrency that are traded within a specific period.
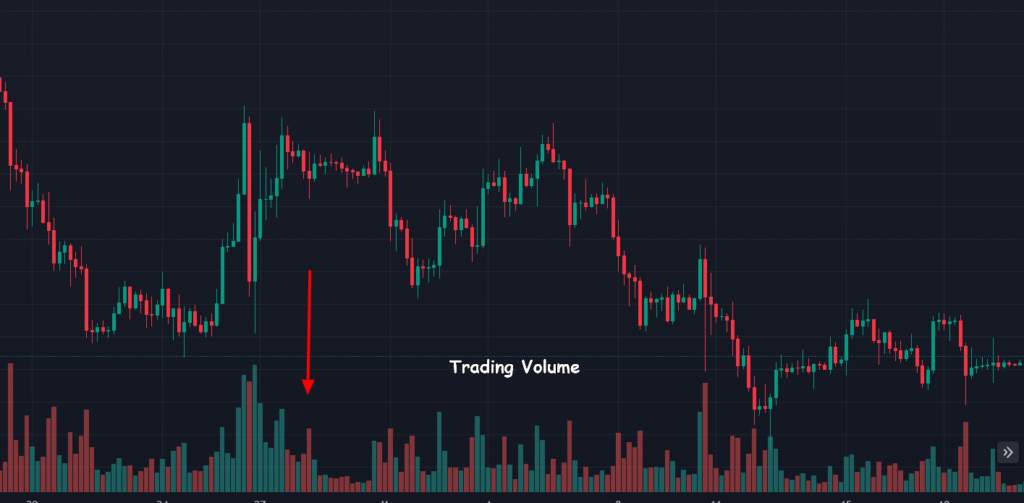
It reflects the buying and selling activity in the market.
High volume indicates significant market participation and suggests increased interest and potential price movement.
Analyzing volume can provide valuable insights.
Here’s how:
- Confirming Price Movements: Volume can validate the significance of price movements. If crypto experiences a price increase accompanied by high volume, it suggests strong buying interest and supports the likelihood of a sustainable uptrend. Conversely, if a price decrease is accompanied by high volume, it indicates strong selling pressure, supporting the potential continuation of a downtrend.
- Identifying Reversals: Volume can help identify potential trend reversals. For example, if a cryptocurrency has been in a downtrend and suddenly experiences a significant price increase accompanied by high volume, it may indicate a possible trend reversal or the start of an uptrend. Similarly, a sharp decrease in volume during a prevailing uptrend could indicate a loss of interest and a potential trend reversal.
- Spotting Accumulation or Distribution: Volume analysis can reveal accumulation or distribution patterns. Accumulation occurs when a cryptocurrency is being accumulated by smart money or institutional investors, leading to a potential price increase. This is often accompanied by above-average volume during periods of price consolidation. Conversely, distribution occurs when investors are selling off their holdings, leading to a potential price decrease. This is typically accompanied by high volume as well.
It’s important to consider volume in relation to the average volume of the cryptocurrency you’re analyzing.
Comparing the current volume to the average volume over a specific period can help identify unusual or significant market activity.
While volume analysis is a valuable tool, it’s essential to use it in conjunction with other indicators and analysis techniques.
By paying attention to volume, you can uncover market interest, confirm price movements, identify potential reversals, and spot accumulation or distribution patterns.
5. MACD (Moving Average Convergence Divergence): Identifying Trend Reversals
When it comes to identifying trend reversals in cryptocurrency trading, the MACD (Moving Average Convergence Divergence) indicator is a powerful tool that traders often rely on.
The MACD combines moving averages and momentum to provide insights into potential changes in market trends.
So, what exactly is the MACD?
It consists of three components: the MACD line, the signal line, and the histogram.
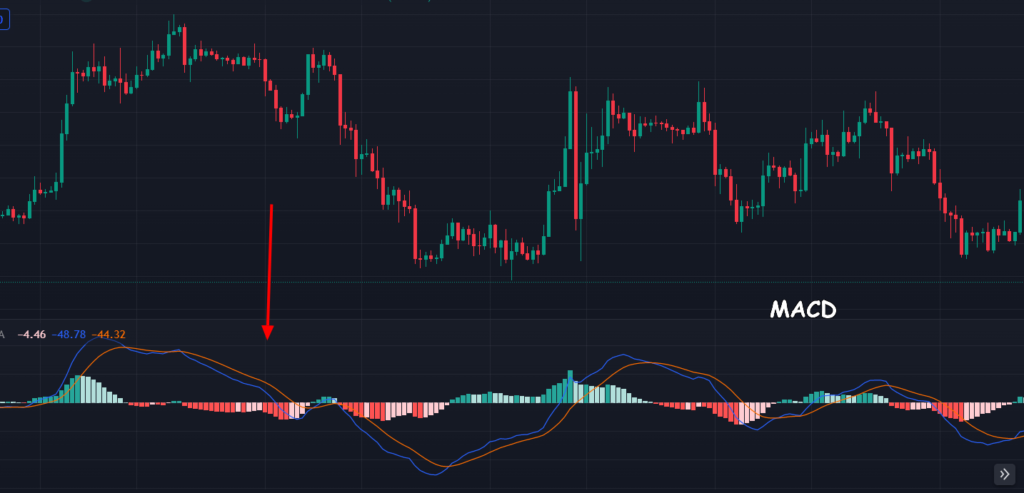
The MACD line is calculated by subtracting a longer-term exponential moving average (EMA) from a shorter-term EMA.
The signal line is a smoothed average of the MACD line, often a 9-period EMA.
The histogram represents the difference between the MACD line and the signal line and provides a visual representation of the convergence or divergence of the two lines.
The MACD helps traders identify potential trend reversals in the following ways:
- MACD Crossovers: A bullish crossover occurs when the MACD line crosses above the signal line, indicating a potential trend reversal from bearish to bullish. Conversely, a bearish crossover occurs when the MACD line crosses below the signal line, suggesting a potential trend reversal from bullish to bearish. Traders often consider these crossovers as potential entry or exit signals.
- Divergences: Divergences occur when the price of a cryptocurrency moves in one direction while the MACD histogram moves in the opposite direction. Bullish divergence happens when the price forms a lower low while the MACD histogram forms a higher low. This suggests a weakening of selling pressure and a potential bullish reversal. Conversely, a bearish divergence occurs when the price forms a higher high while the MACD histogram forms a lower high, indicating a potential bearish reversal.
By incorporating the MACD into your analysis, you can gain insights into the strength and direction of trends, potential trend reversals, and the timing of entry and exit points.
However, it’s important to note that the MACD is not a standalone indicator, and it should be used in conjunction with other analysis tools and top indicators for confirmation.
Tips for Using Indicators Effectively
When using indicators, consider the following tips:
1. Avoid over-reliance on a single indicator
Relying solely on one indicator can lead to false signals and misinterpretation of market trends.
Instead, use multiple indicators to gain a comprehensive view of the market.
Look for indicators that complement each other and provide different perspectives on market dynamics.
[READ: 7 Common Mistakes Crypto Investors and Traders Make]
2. Backtest and validate indicators
Before using an indicator in live trading, it’s beneficial to backtest it using historical data to assess its performance and reliability.
This helps you gain confidence in the indicator’s effectiveness and understand how it performs in different market scenarios.
3. Understand the purpose
Know the purpose of the indicator you’re using.
Indicators are designed to provide specific insights or measure progress toward a goal.
Ensure you have a clear understanding of what you want to track or assess.
4. Keep it relevant
Choose indicators that align with your objectives.
Select indicators that directly reflect the information or progress you need to monitor.
Irrelevant indicators can lead to confusion and distract from important data.
5. Avoid information overload
Focus on a few key indicators that provide meaningful insights.
Too many indicators can be overwhelming and dilute your attention.
Identify the critical few that will guide your decision-making effectively.
Common Mistakes to Avoid in Using Indicators
When using indicators, there are several common mistakes that traders and analysts should avoid:
1. Neglecting personal judgment
Indicators are tools, not decision-makers.
It’s essential to combine indicators with personal judgment, experience, and intuition when making trading decisions.
2. Over-optimization
Tweaking indicator settings excessively to fit historical data (curve fitting) can lead to poor performance in live trading.
Avoid over-optimization and ensure that indicators are tested on a diverse range of market conditions.
3. Not considering false signals
Indicators generate both valid and false signals.
It’s important to evaluate the accuracy and reliability of an indicator in different market conditions before making trading decisions.
[READ: 7 Best Ways to Secure Your Cryptocurrency]
4. Neglecting risk management
Indicators provide insights, but they don’t guarantee success.
Traders must incorporate proper risk management techniques, such as setting stop-loss orders and managing position sizes, to protect against potential losses.
5. Using lagging indicators alone
Relying solely on lagging indicators (e.g., moving averages) can result in delayed signals, leading to missed opportunities or entering/exiting trades too late.
Consider using leading indicators or a combination of both.
6. Relying solely on indicators without considering other factors
Indicators provide valuable information, but they should not be the sole basis for trading decisions.
It’s important to consider other factors such as market fundamentals, news events, and overall market context to make well-informed trading decisions.
Conclusion
Understanding the top indicators for crypto trading can make a world of difference in your investment journey.
By keeping a close eye on these signals, you’ll be equipped with valuable insights that can help you navigate the volatile crypto market more confidently.
Remember, successful trading is not just about luck but about informed decision-making.
These top indicators can give you an edge in identifying trends, spotting potential entry and exit points, and managing your risk effectively.
However, it’s important to acknowledge that no indicator is foolproof.
Crypto trading is still a highly speculative and volatile arena, so it’s crucial to combine your technical analysis with fundamental research and market sentiment.
So, whether you’re a seasoned trader or just dipping your toes into the crypto waters, make sure to familiarize yourself with these top indicators and incorporate them into your trading strategy.
I hope you found this guide helpful.
I have also written some other crypto blog posts that will help you in your cryptocurrency journey.
Check them below.
You should also check us out on Twitter and Instagram to follow us and stay up-to-date with the industry.
read also:
- How to Avoid Losses in Crypto Trading
- The Do’s and Don’ts of Investing in Cryptocurrency
- How to Read a Crypto Candlestick Chart Like a Pro
- 5 Best Crypto Exchanges For Trading Cryptocurrencies
- How to Become Successful in Cryptocurrency
IMPORTANT; you must never send money to anyone you meet online asking to help you invest in cryptocurrency. They are scammers. Crypto is easy, and you can do it all by yourself.
DISCLAIMER:
The information presented here should not be used as the sole basis of any investment decisions, nor should it be construed as financial, tax, legal, or accounting advice. I will also advise that you invest in cryptocurrency only what you are comfortable living without, at least temporarily.